Setup and Sync #
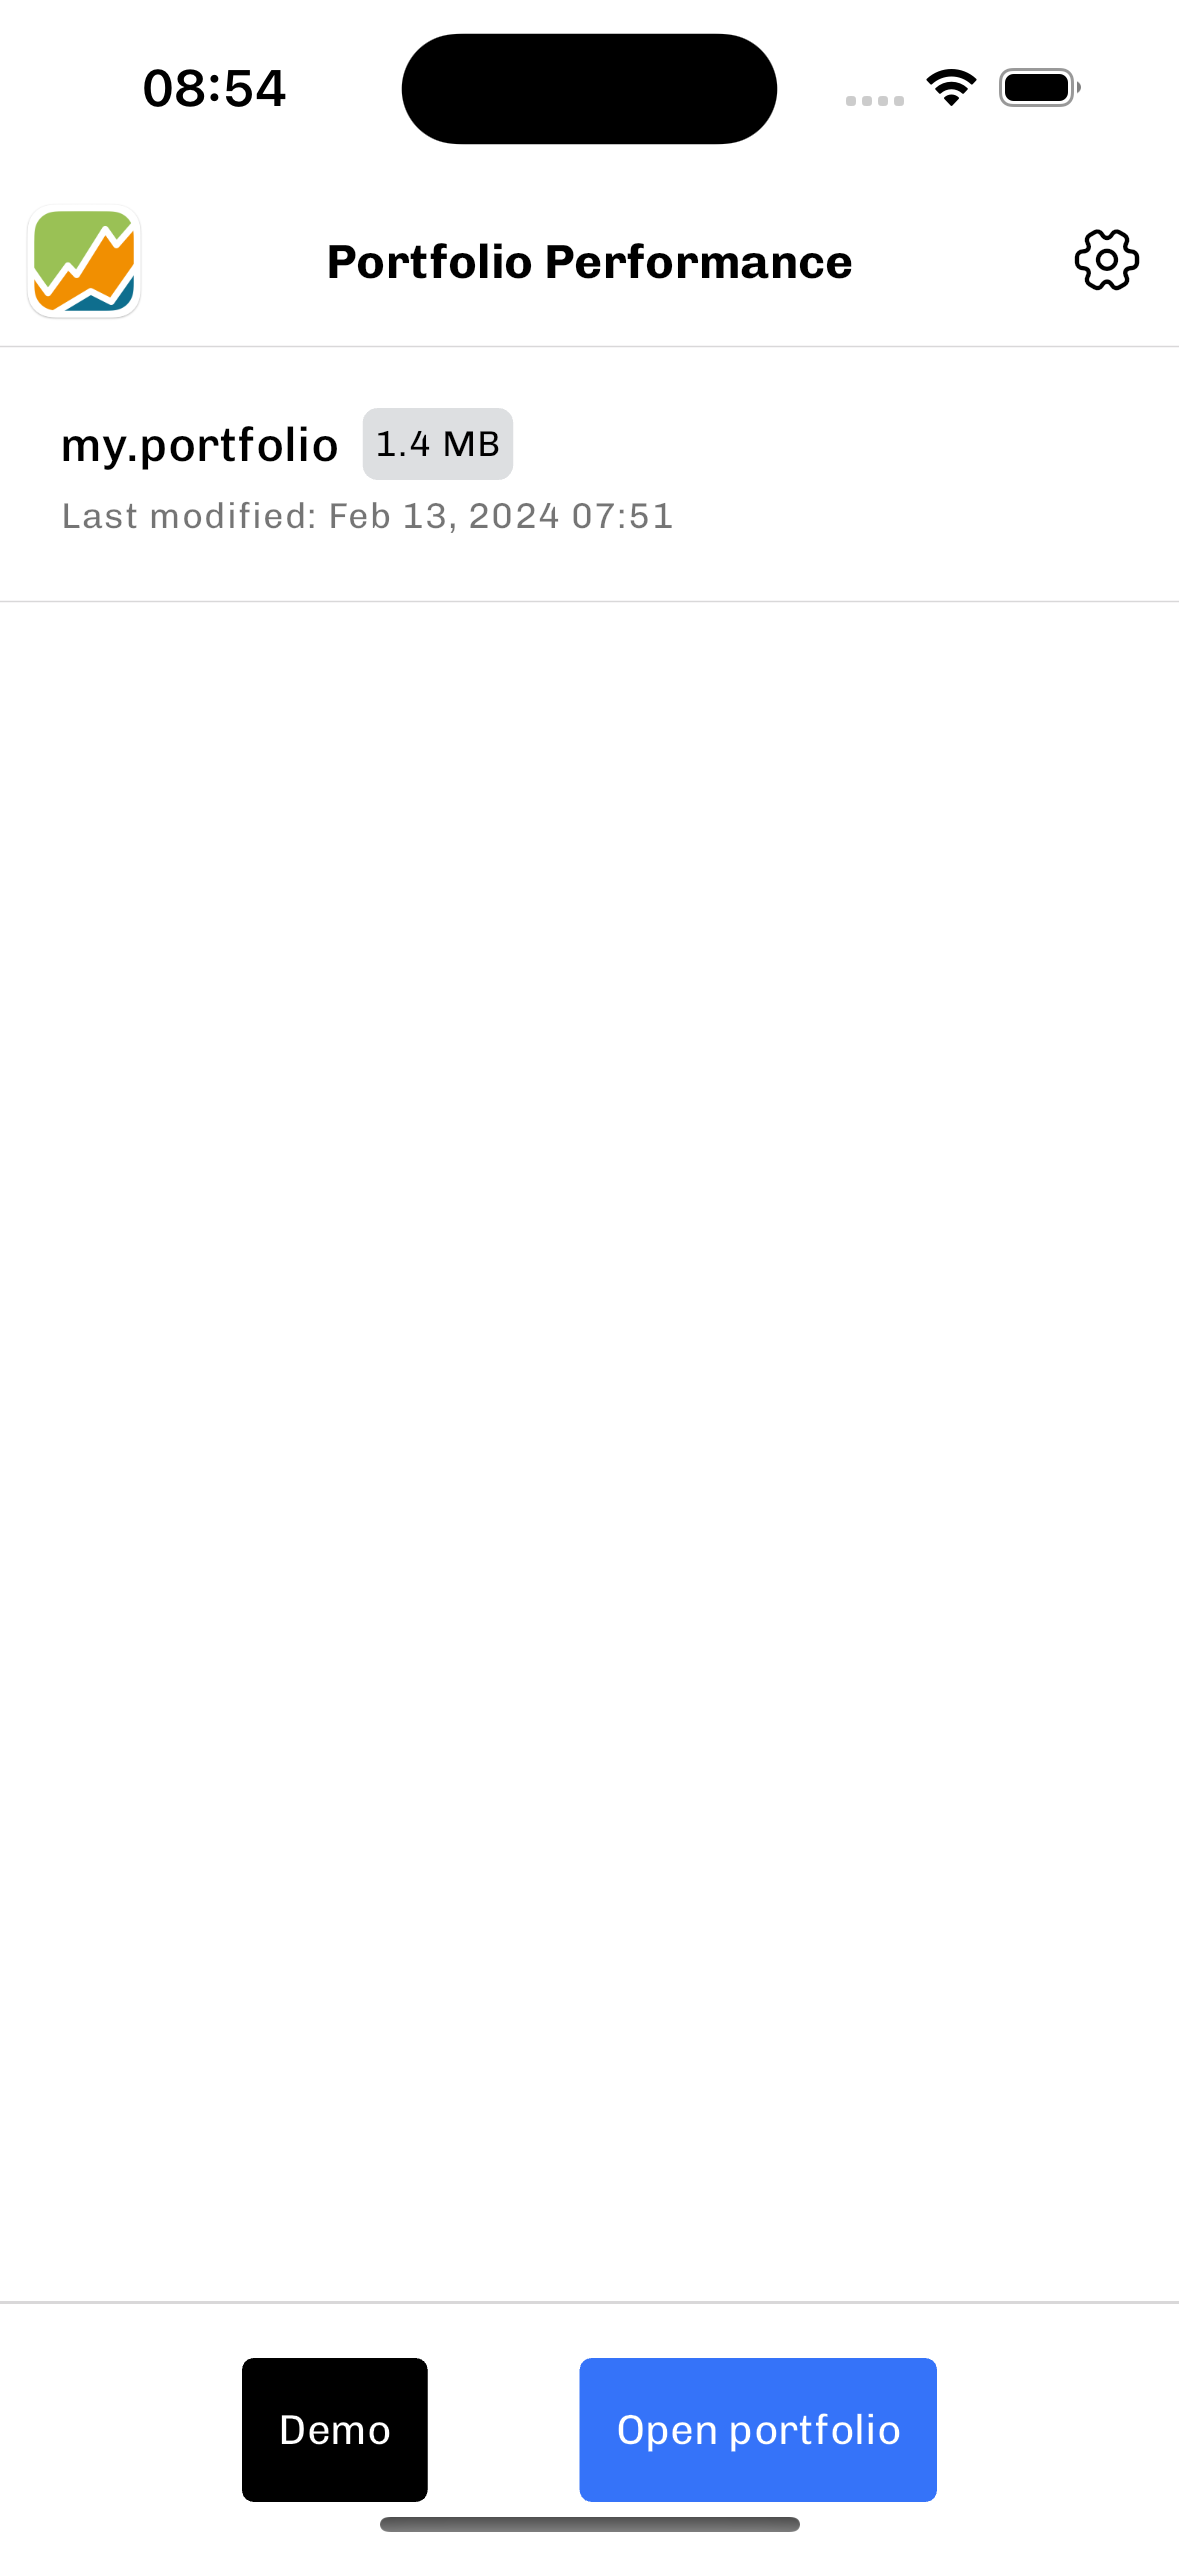
Quickly access your previously opened portfolio files on the first screen.
- Open a File: Tap on its tile.
- Remove a File: Swipe the tile left.
- Reorder Files: Tap and hold a tile, then move it to your preferred position.
Syncing Your Portfolio File from Desktop to Mobile:
Ensure your portfolio file is saved in "binary" format on your chosen cloud storage service (such as iCloud, Google Drive, or OneDrive) using the menu option "File" -> "Save as" -> "Binary". This format is currently the only one supported by the mobile app due to its efficiency and small size. Storing the file directly on a cloud service allows for seamless updates and access on the mobile application.
Note: Mobile operating systems allow apps to access only those files which are explicitly selected by the user. If a new file replaces an old one with the same name, the system may revoke access permissions, making the file unreadable by the app. Therefore, updating the existing file via the desktop application is crucial.
Setting Up the Storage Provider on Your Phone:
For the app to function properly, configure your preferred cloud storage provider on your device.
See Apple help on how to Use third-party cloud apps in the Files app. The gist is:
- Install the desired third-party cloud app.
- Open the "Files" app and tap "Browse".
- Select "more" (the three dots), then "Edit".
- Enable the chosen cloud service provider.
Install third-party apps that are supported by Android File Manager.
Navigation #
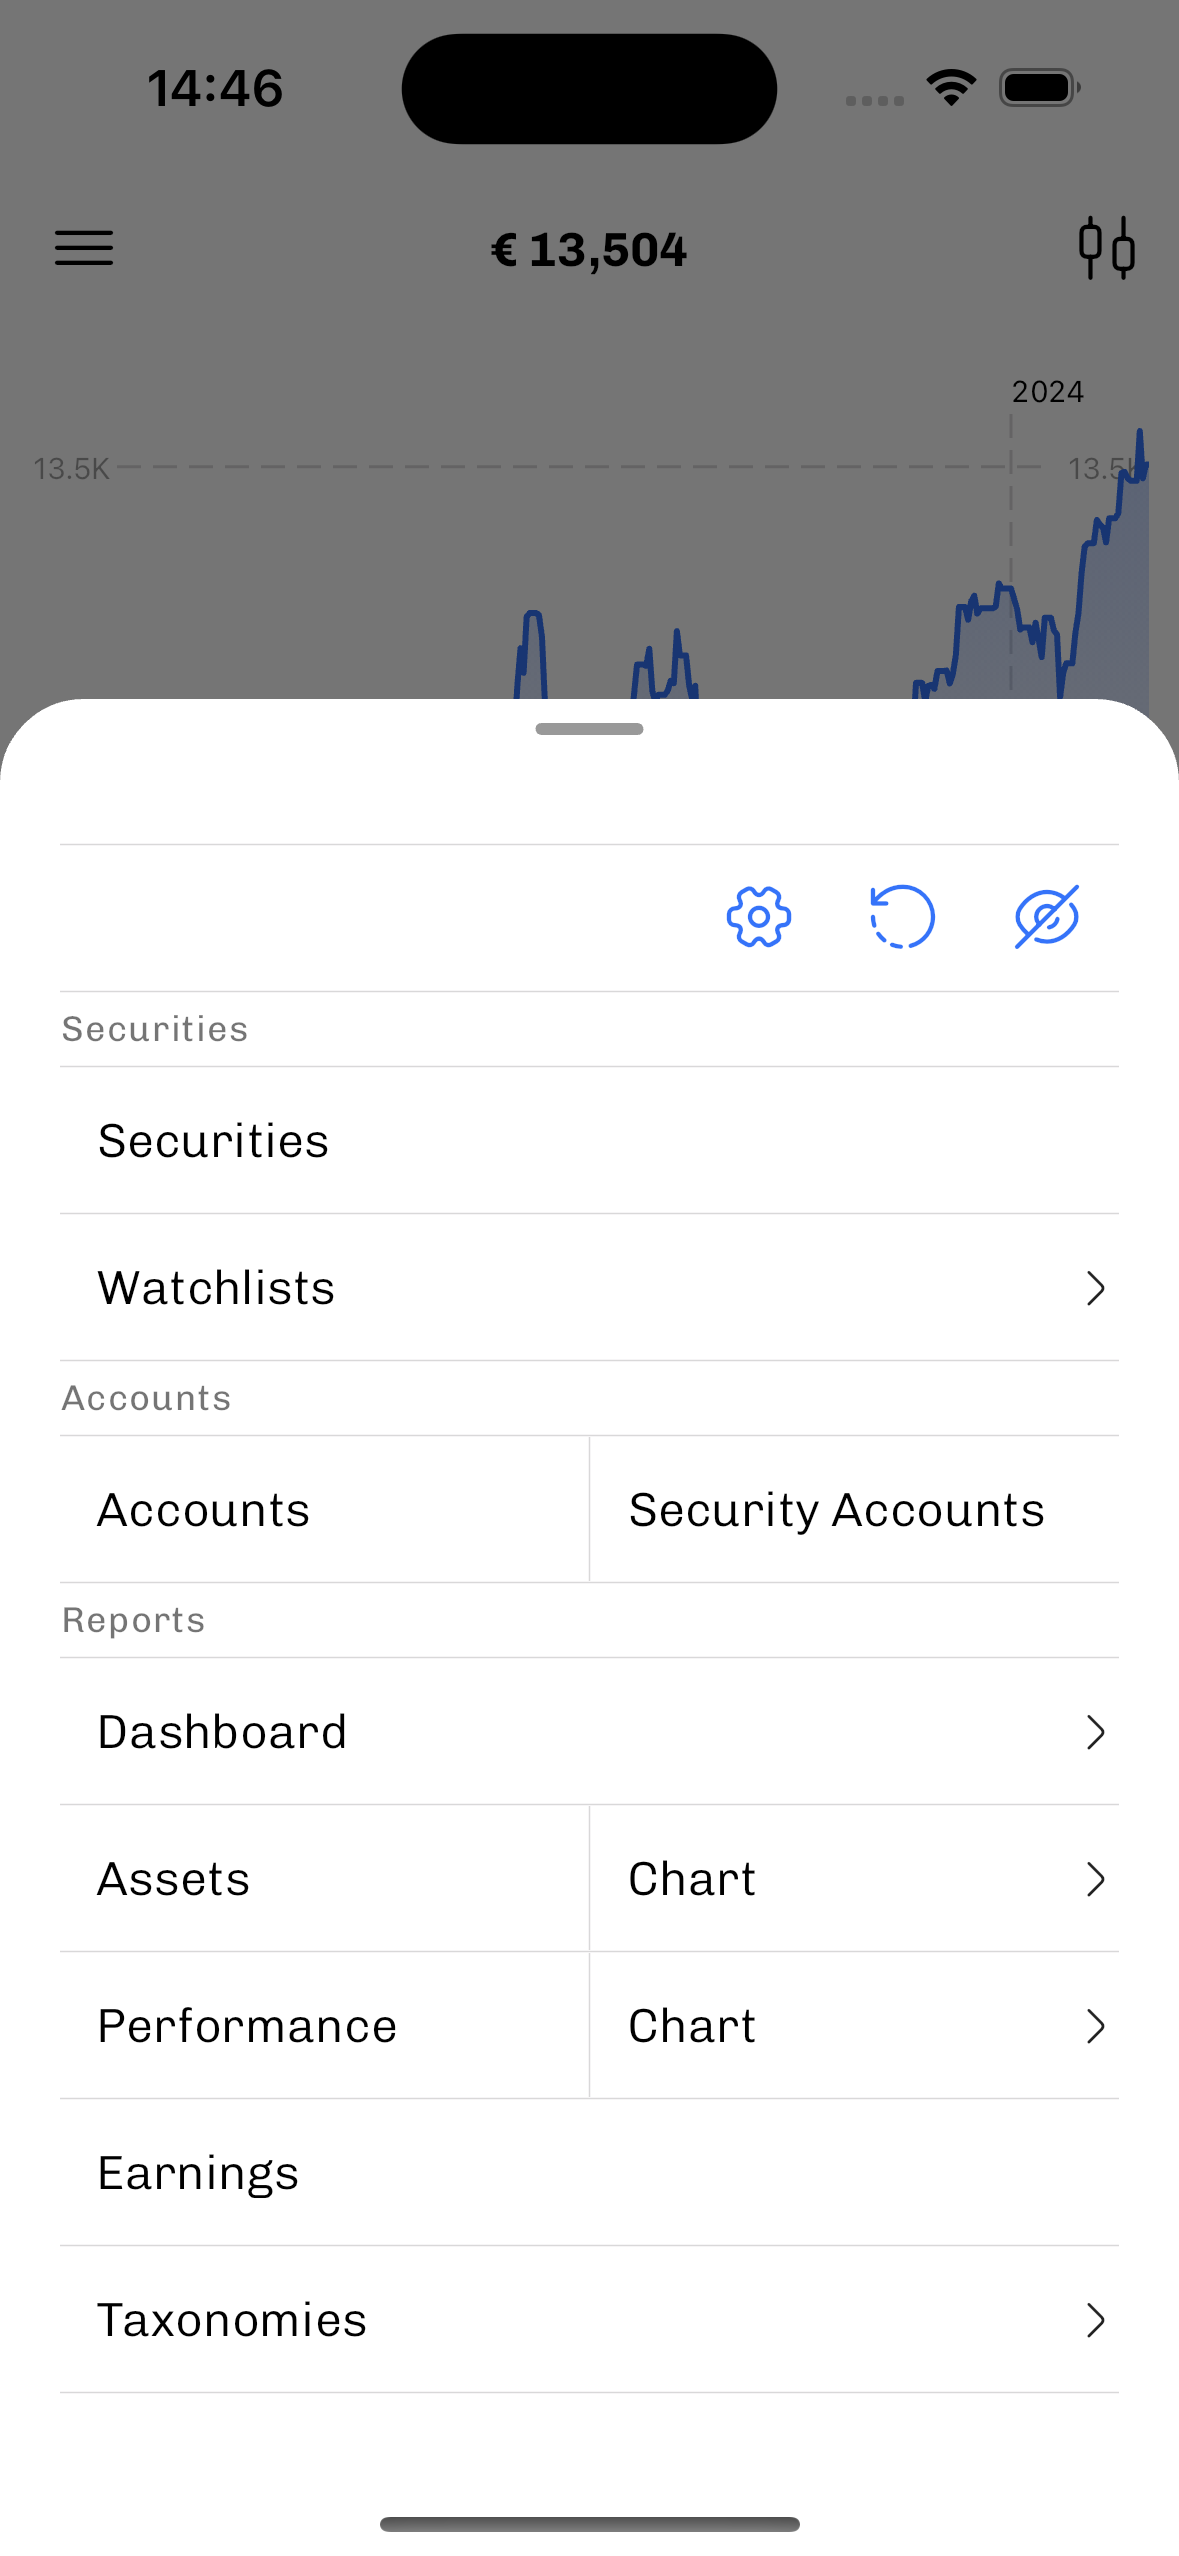
The app's bottom navigation bar offers swift access to its various features. The far-right icon opens the 'Menu' screen, as illustrated below, which serves as your gateway to all other screens in the app. This navigation mimics the structure of the desktop application for familiarity.
At the top of the menu, you'll find several functional buttons. Starting from the left, these buttons allow you to:
- Access and adjust settings,
- Initiate updates for historical prices,
- Enable discreet mode, which conceals absolute numerical values.
Filter Sidebar #
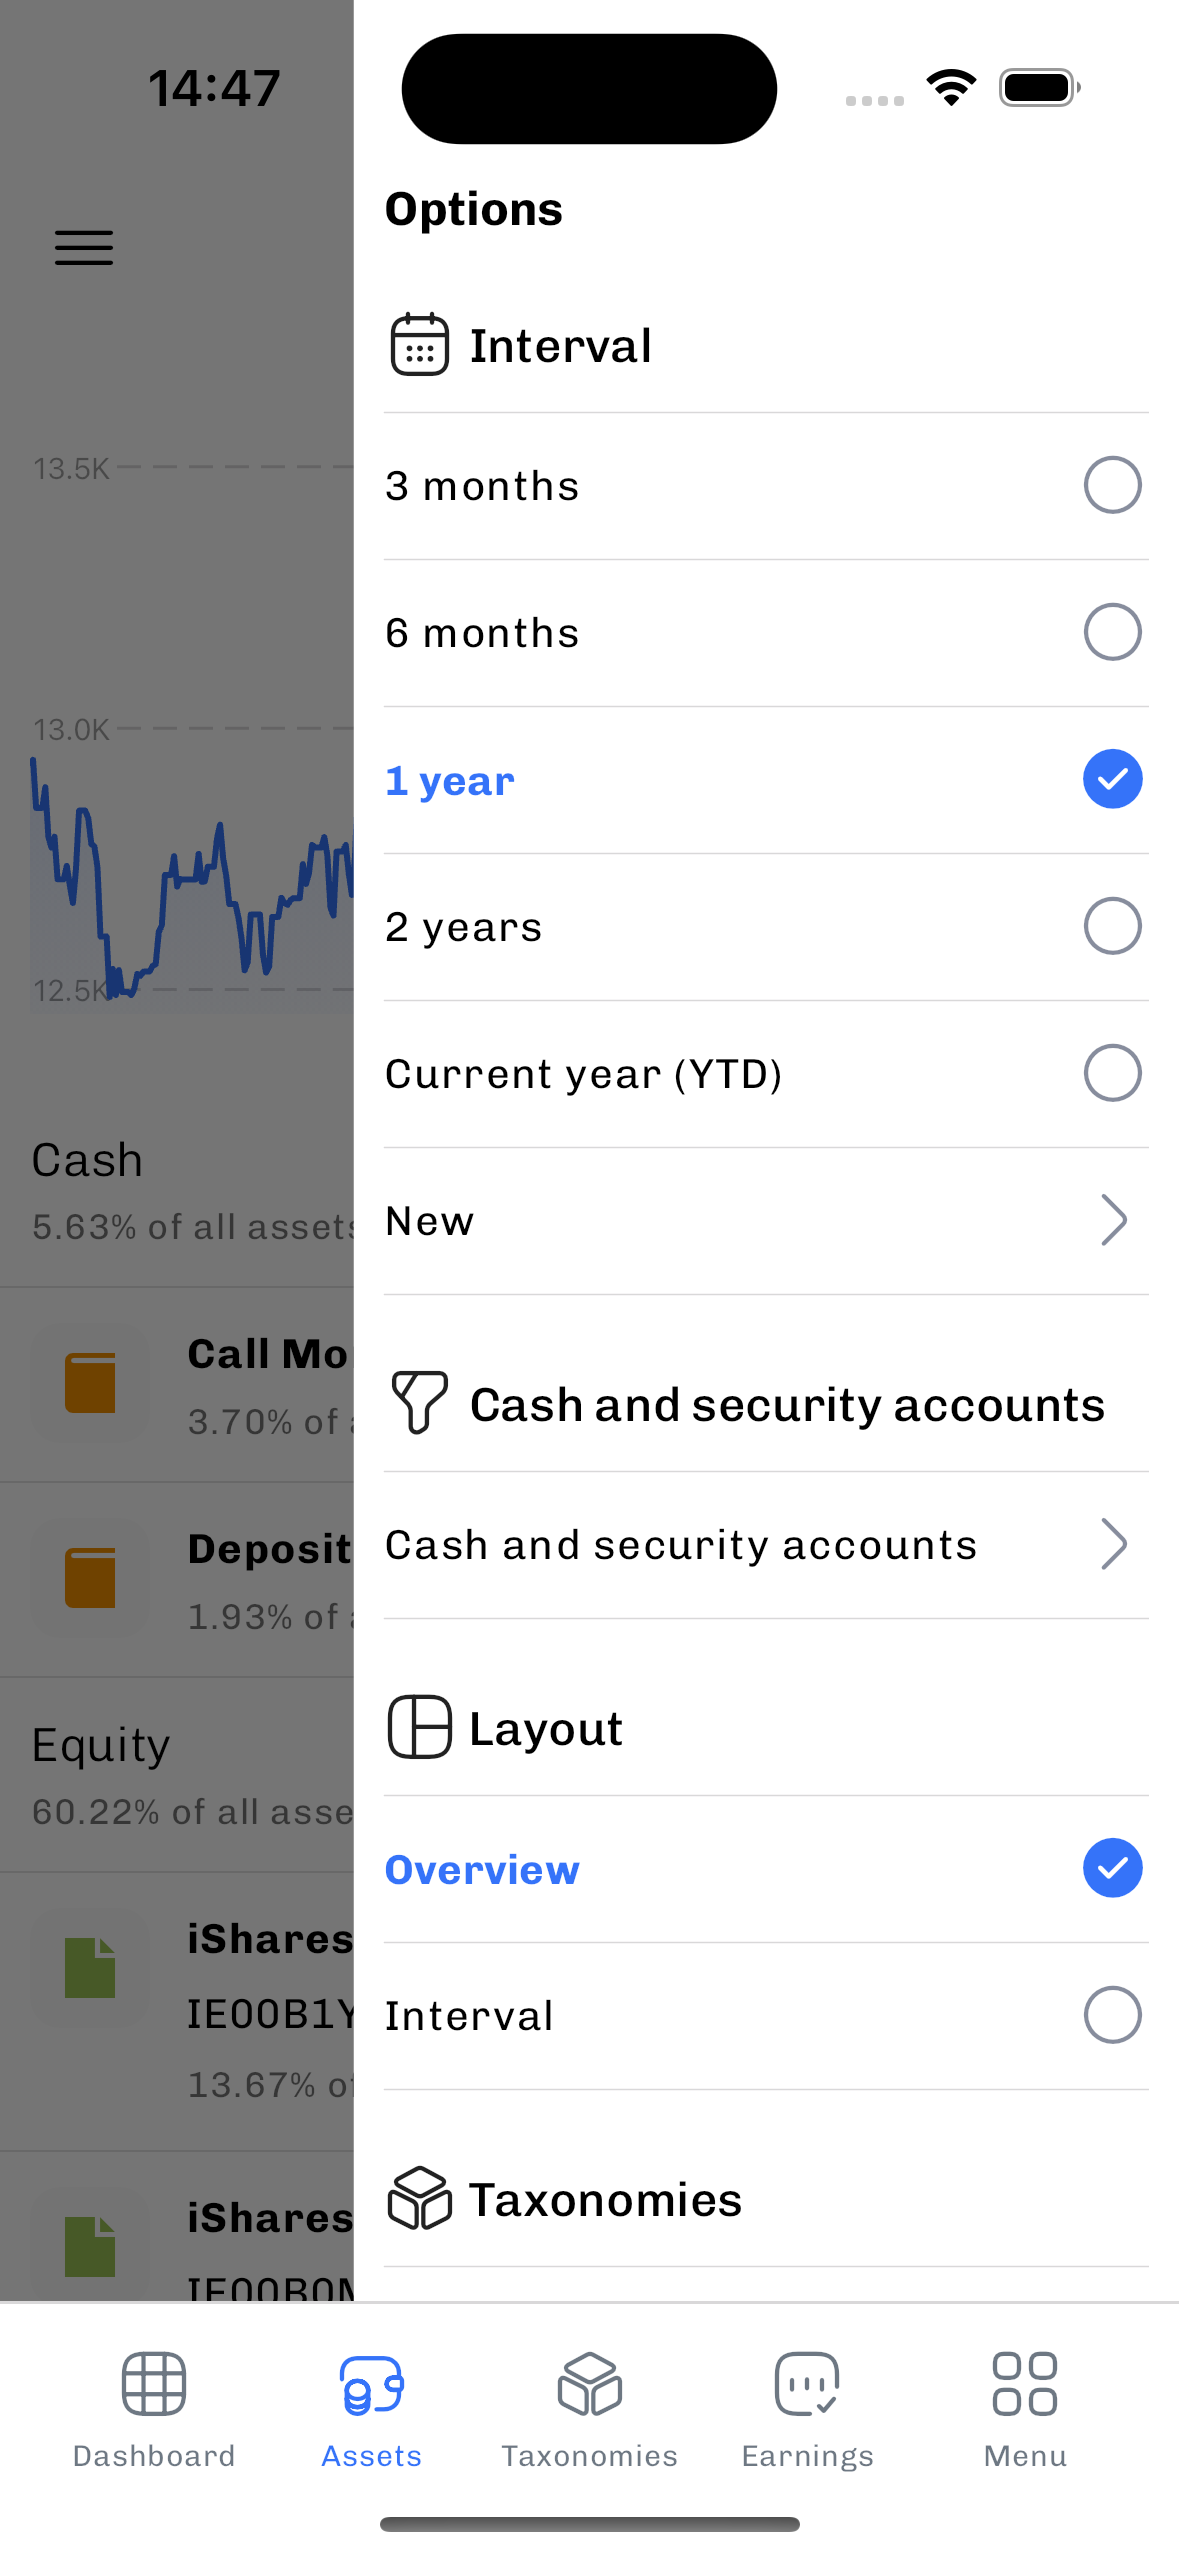
To customize your current view, open the filter sidebar by clicking the icon in the top right corner of the screen. The options available in the sidebar will vary depending on the main screen you are using.
For iPhone users, you can also open the filter by swiping from the right edge of the screen. Android users have the same option, although the global 'gesture navigation' might pick up the swipe first. For me, it works best to tap and briefly hold and then swipe to open the sidebar.
Note that some settings in the filter sidebar may also affect other views. For instance, changing the time interval in the filter will apply this change across other screens. This feature is designed to help you analyze your portfolio from various perspectives while maintaining the same time interval for consistency.
Historical Price Chart #
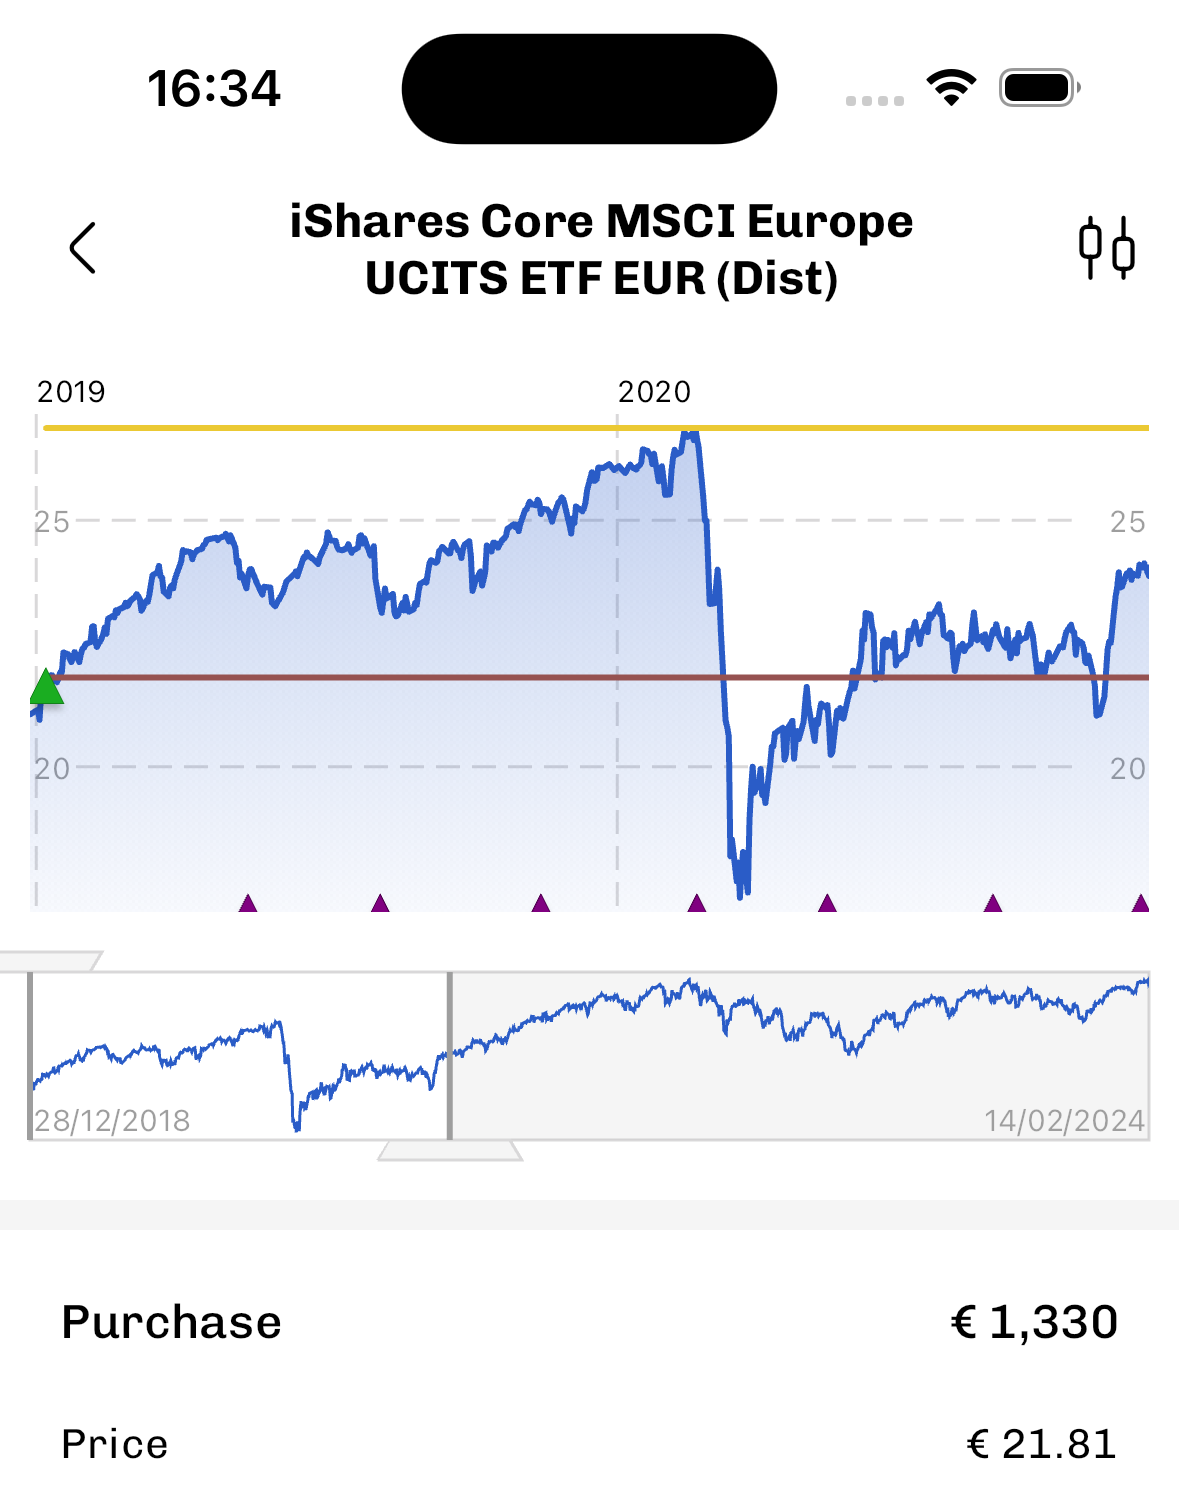
Add additional information to the historical price chart:
- Transaction Events: Track your buy and sell events.
- Dividend Events: See when dividends occurred.
- FIFO Purchase Price: Visualize your First-In-First-Out (FIFO) purchase prices.
- Shares Held: Keep an eye on the quantity of shares you hold over time.
Interactive Chart Features:
- Tap and Swipe: Interact with the chart to display the exact prices, the dividend per share, and the FIFO purchase prices.
- Landscape Mode: Rotate your phone to landscape for a full-screen chart view.
Using the Range Selector:
- Move the Range: Tap and swipe within the white area of the range selector to shift the displayed range.
- Adjust the Range Edges: Tap and swipe at the right or left edges of the range selector to modify the range. The edges are responsive even a few pixels outside the selector, ensuring ease of use.
- Double Tap: Double-tap the range selector to view the entire interval. A second double-tap zooms in on the mid-section for detailed analysis.
Historical prices are updated on your phone using the settings of each instrument as configured in your file. Scroll down to the bottom of the instrument page and tap "Available actions" and "Update prices" to update only the prices of the current instrument.
Dashboards #
Dashboards allow you to track your investments with the set of indicators that make most sense to you. The mobile app already supports 36 of the 48 widgets available in the desktop version.
Display and Navigation of Desktop Dashboards on Mobile
- Swipe between columns: Each column of your desktop dashboard is transformed into a separate page within the mobile app. This allows you to swipe left or right to view different sections of your dashboard, ensuring a seamless transition from desktop to mobile.
- No Edit Mode for Desktop Dashboards: It's important to note that desktop dashboards cannot be directly edited on your mobile device. However, you can select the 'Mobile Dashboard' and edit it according to your needs.
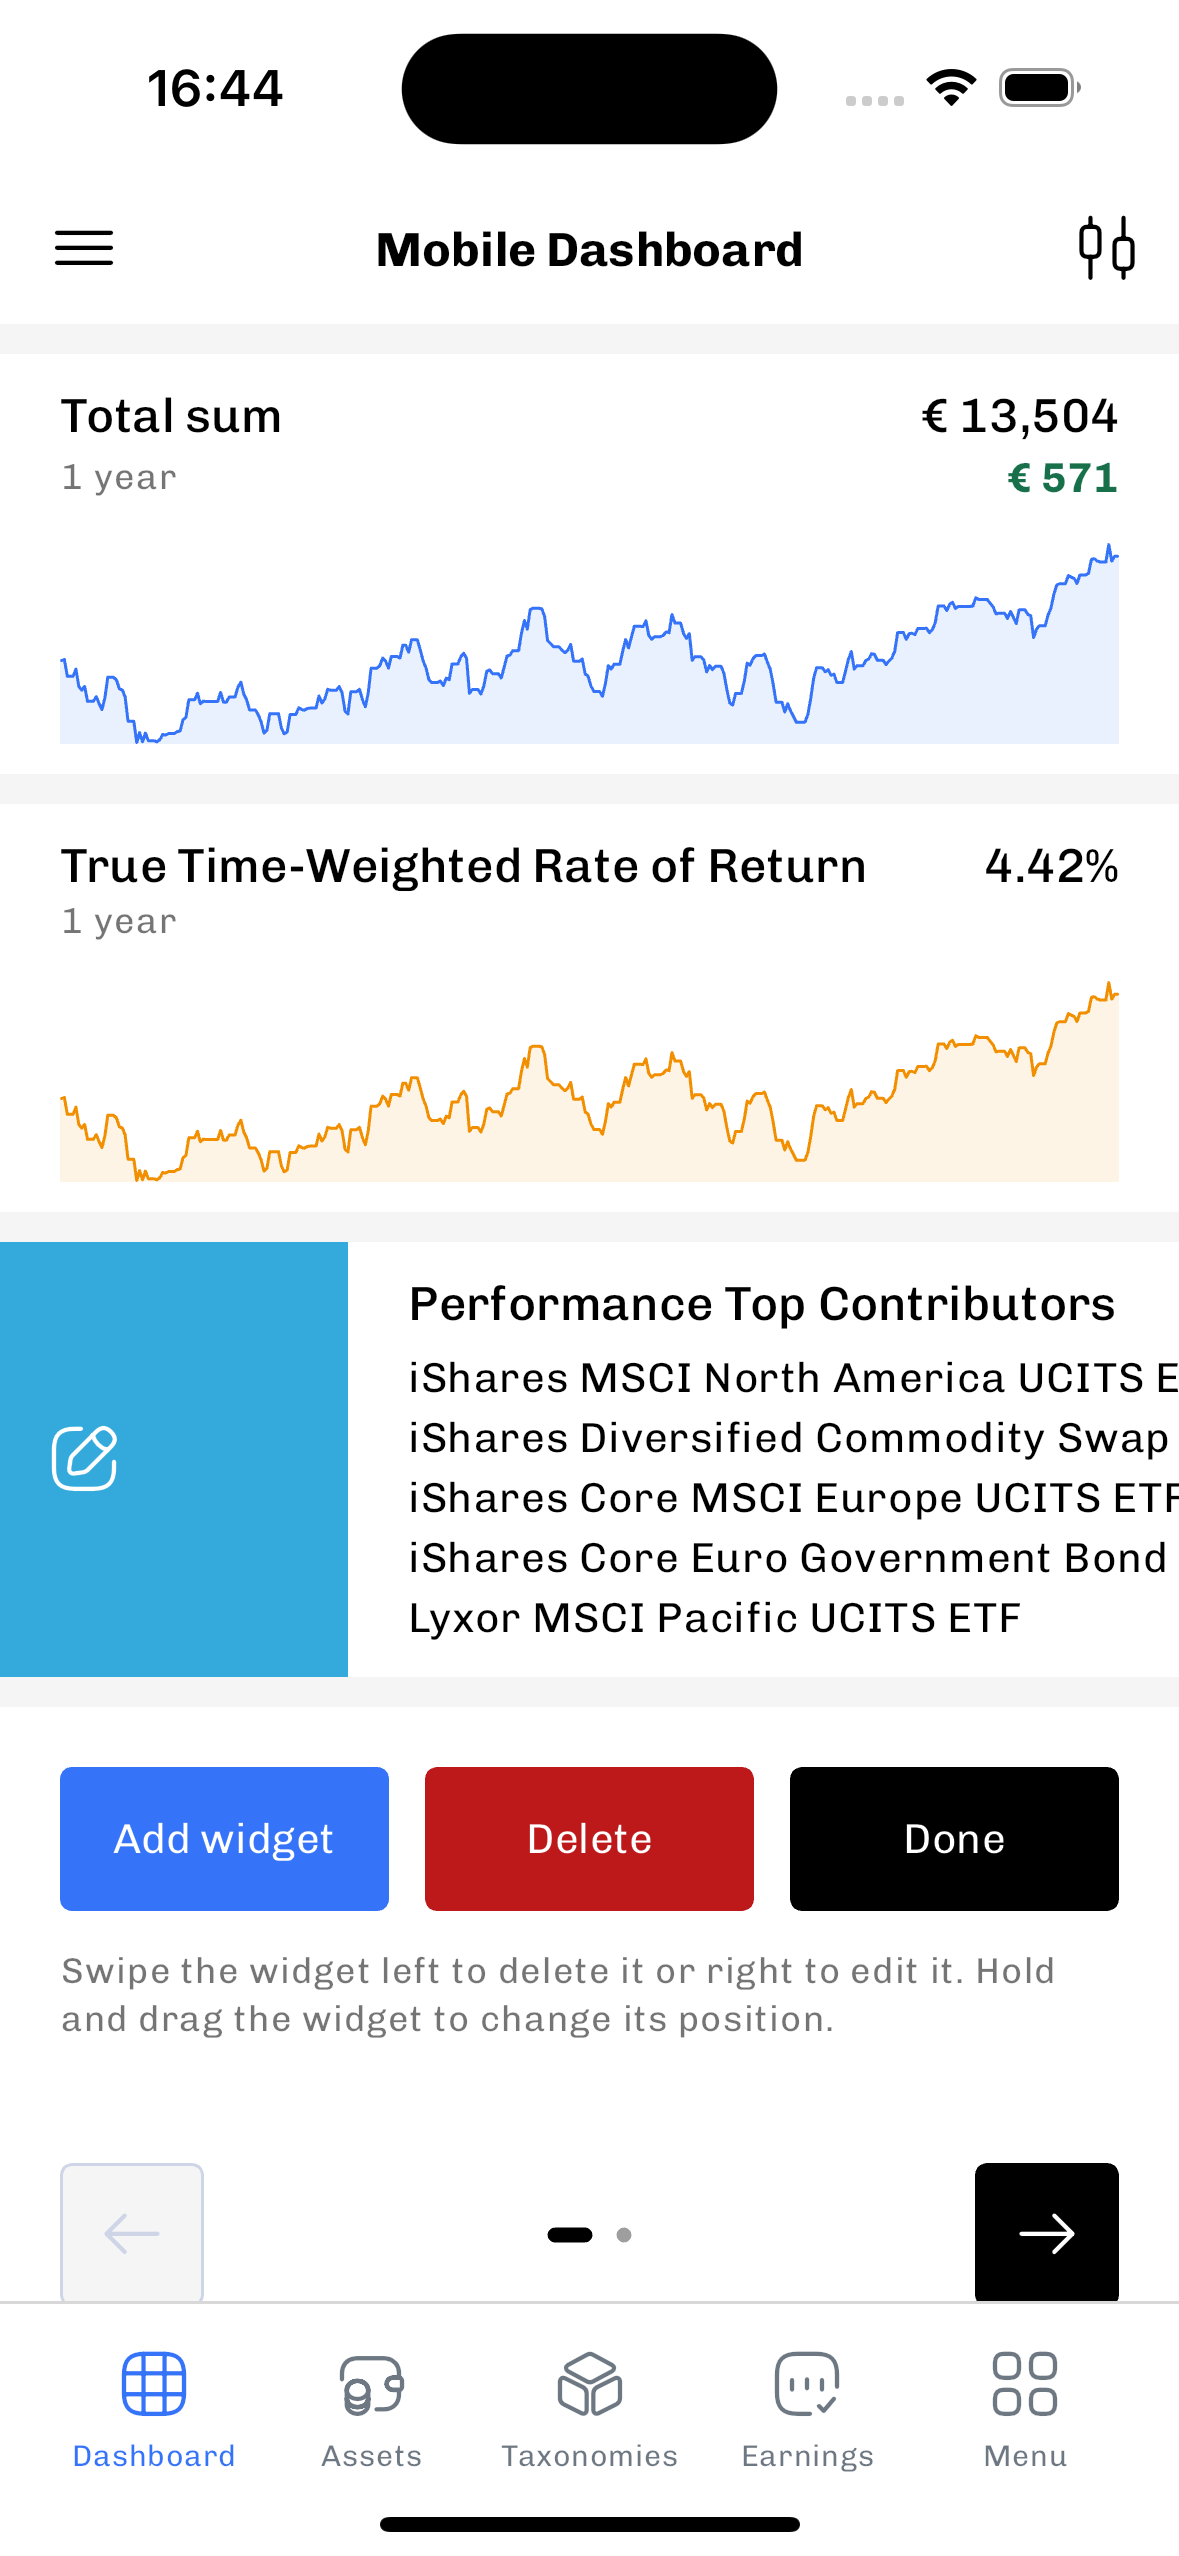
Customizing Your Mobile Dashboard
- Edit Widget Parameters: Swipe right on a widget to modify settings like time intervals and filters.
- Remove Widgets: Swipe left on a widget to delete it.
- Add New Widgets: Select new widgets to add to your dashboard using the "Add widget" button. Some widgets, like instrument prices, can be added from their specific pages by selecting "Add to Dashboard."
- Delete a Page: Tap "delete" to remove an entire page, which equates to a column from the desktop version.
- Rearrange Dashboard Pages: Shift pages/columns around using the left or right arrow buttons.
- Exit Editing: Tap "done" after making changes to exit the editing mode.
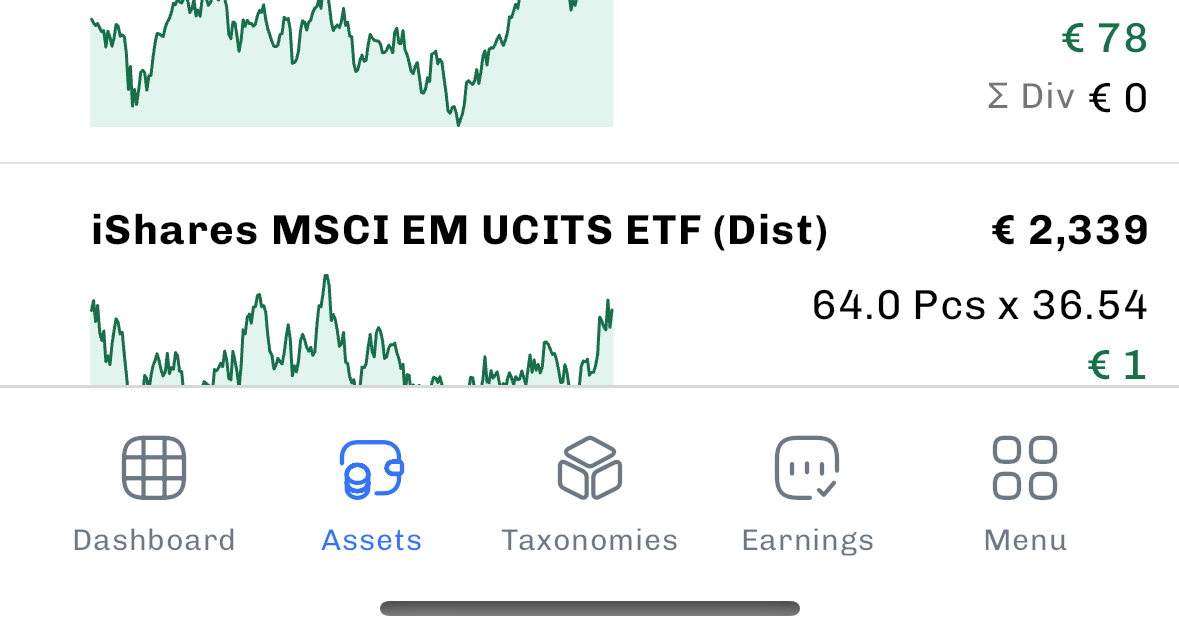
Statement of Assets #
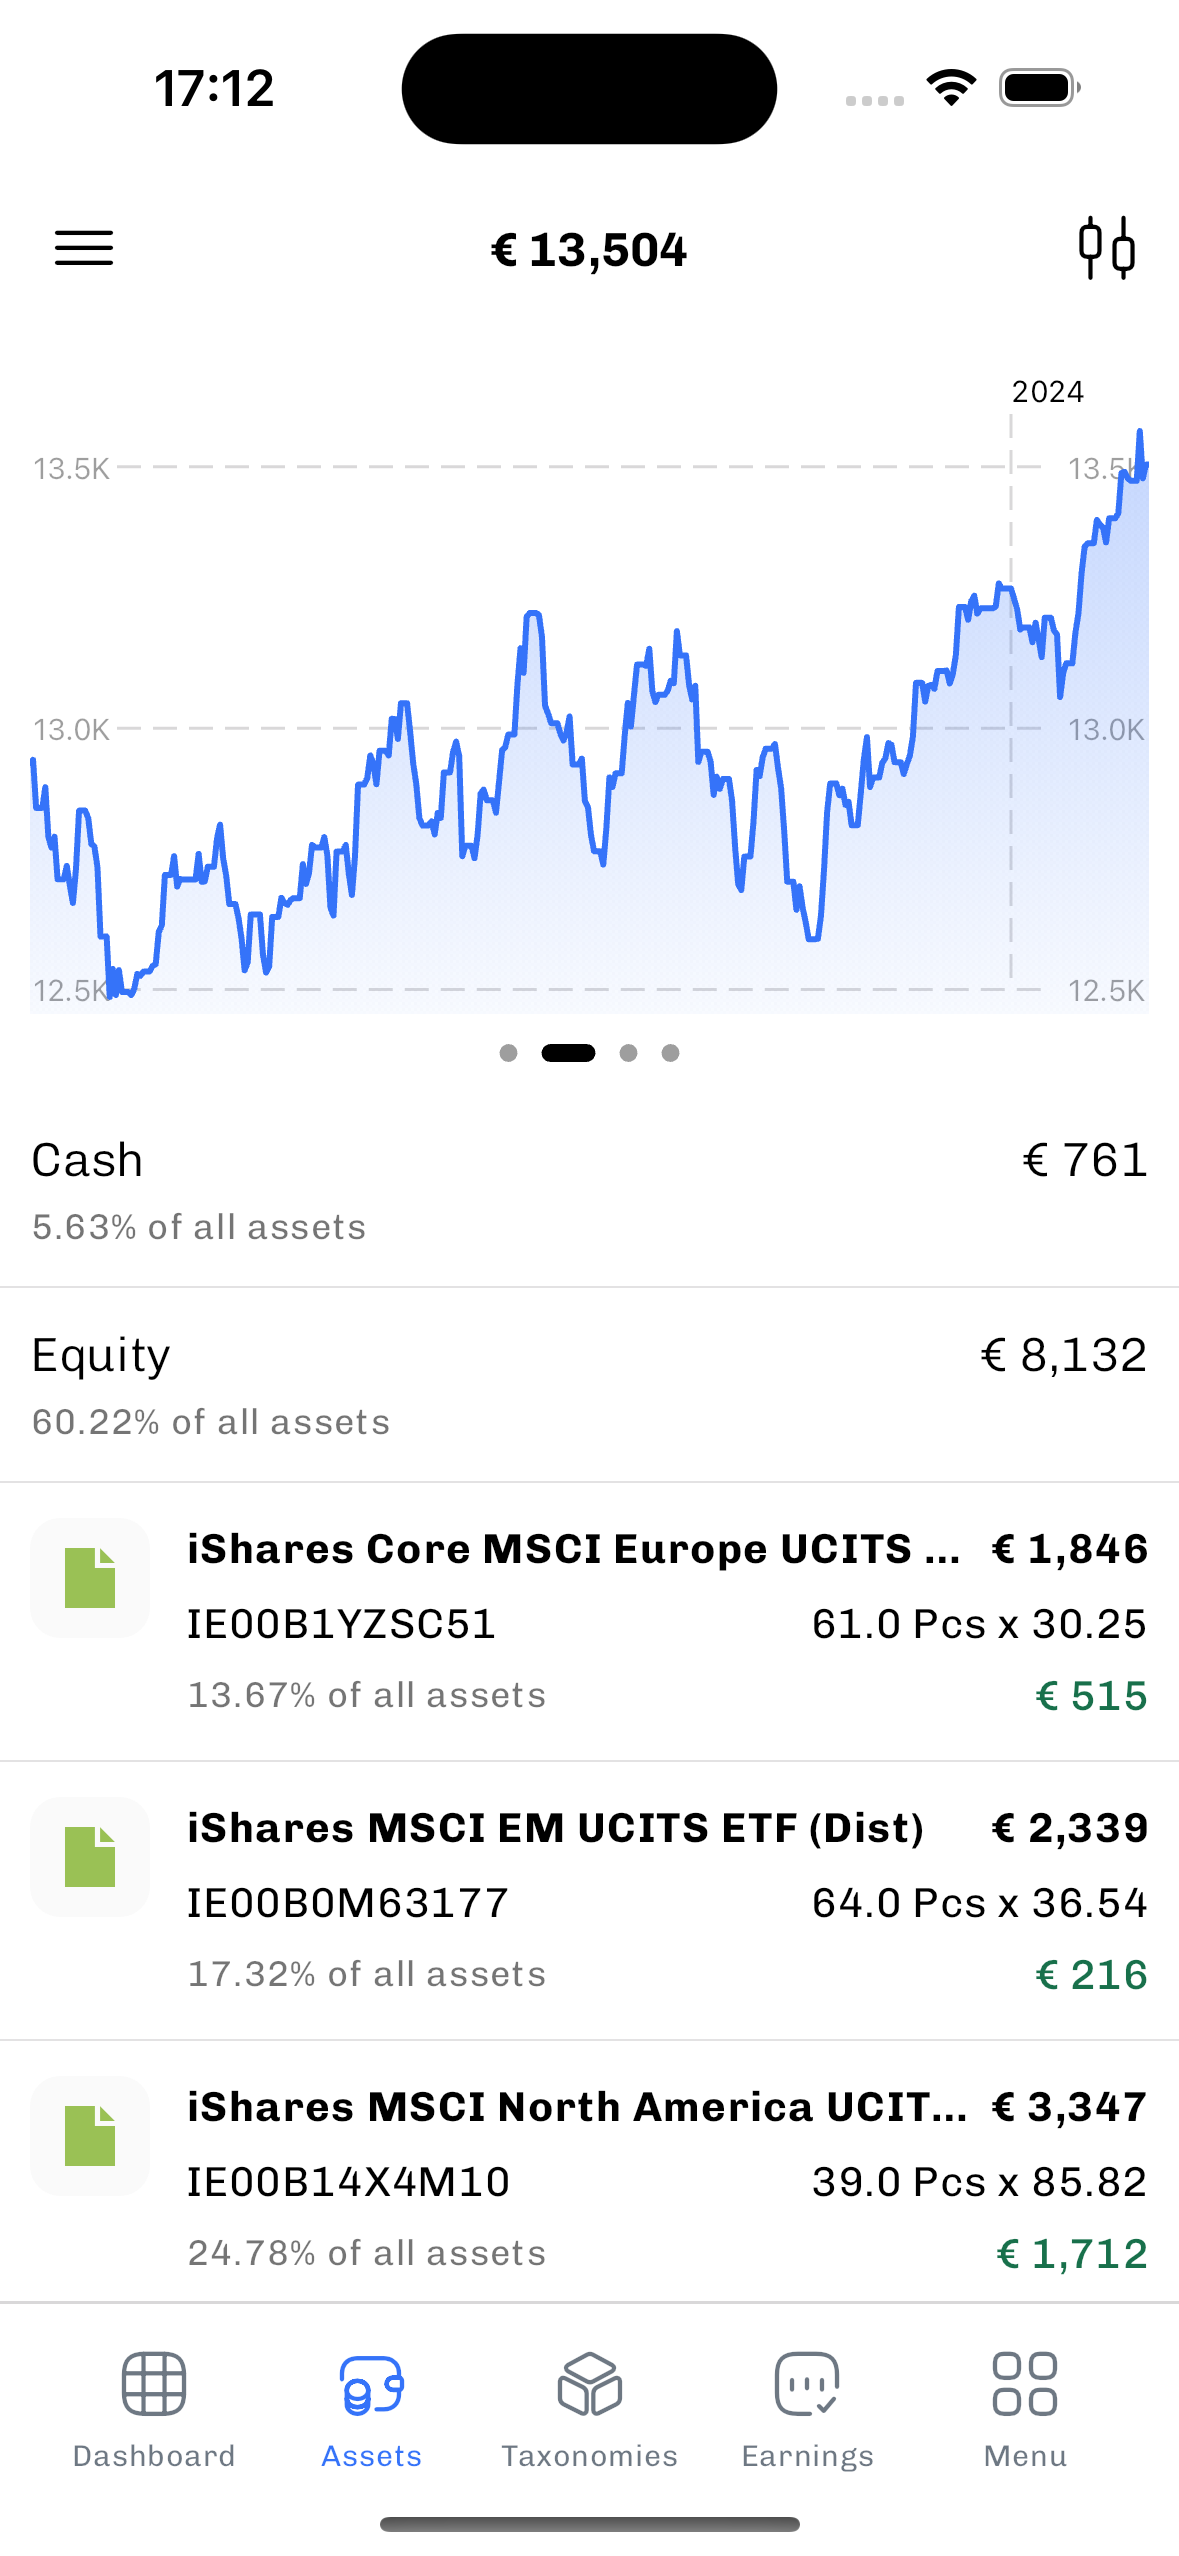
The Statement of Assets View provides a comprehensive overview of your portfolio, structured into two main parts for easy analysis:
Top Section: Dynamic Charts
- Donut Chart of Holdings: Visualize the distribution of your holdings.
- Portfolio Value Line Chart: Track the total value of your portfolio in real-time.
- Portfolio Performance Line Chart: Observe the true-time weighted rate of return of your portfolio.
- Holdings by Taxonomy Donut Chart: See the breakdown of holdings grouped according to your selected taxonomy.
Lower Section: Detailed Position Information
- Taxonomy Grouped Positions: Positions are grouped by your chosen taxonomy. Tap on a category to expand or collapse the list of positions.
- Context Menu Access: Long-press on a position to access a context menu specific to that instrument.
- Instrument Details: Tap on an instrument to view detailed information about the position. Swipe left or right to navigate between positions.
Customizable Layouts with Filter Sidebar
- Current Value and Profit/Loss: Displays the current value and profit/loss for each position.
- Interval: Focuses on showing changes over a selected time frame, such as the last month, year, or year-to-date (YTD). This layout is particularly useful for understanding recent portfolio changes.
Taxonomies #
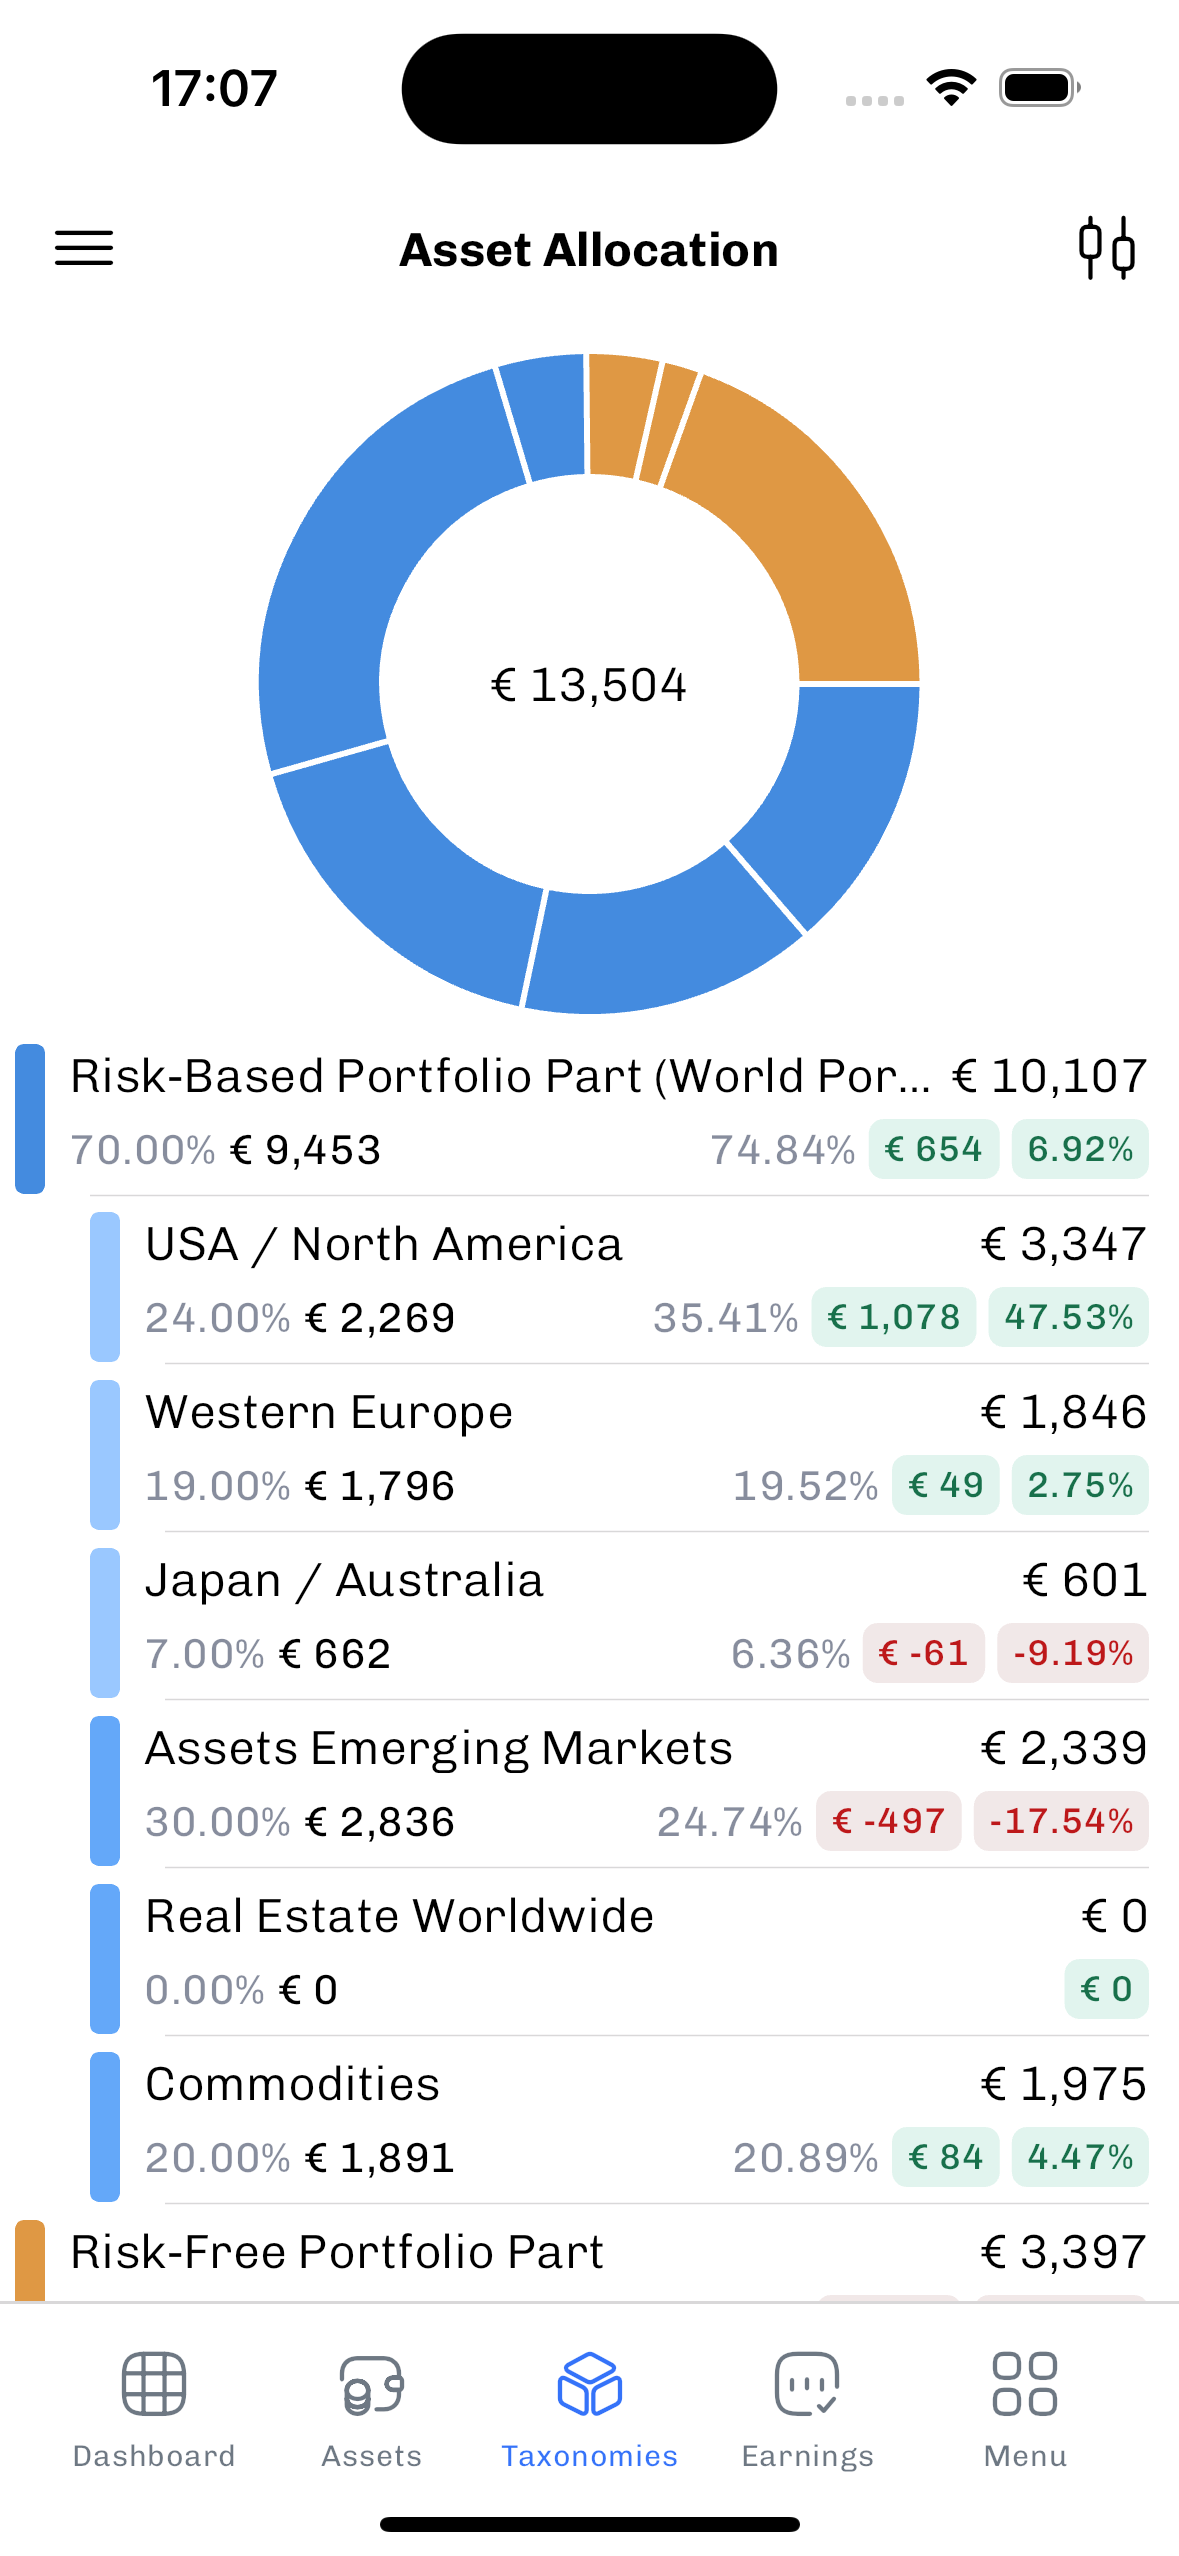
The Taxonomy View allows you to categorize and analyze your portfolio according to your own defined categories. This feature in the mobile application offers a simplified version of the desktop taxonomy view, focusing on exploring the tree structure and valuation of your investments.
- Rebalancing Layout: This layout displays target values (both percentage and absolute valuation) alongside current values (percentage, absolute valuation, and the difference). Green indicates a current value above the target, while red indicates a value below the target.
- Position Details: Tapping on a position reveals more information about it. You can swipe left or right to navigate between different positions.
- Pie Chart Details: Tapping on the pie chart in the taxonomy view brings up detailed information about each specific position in your portfolio.
Earnings #
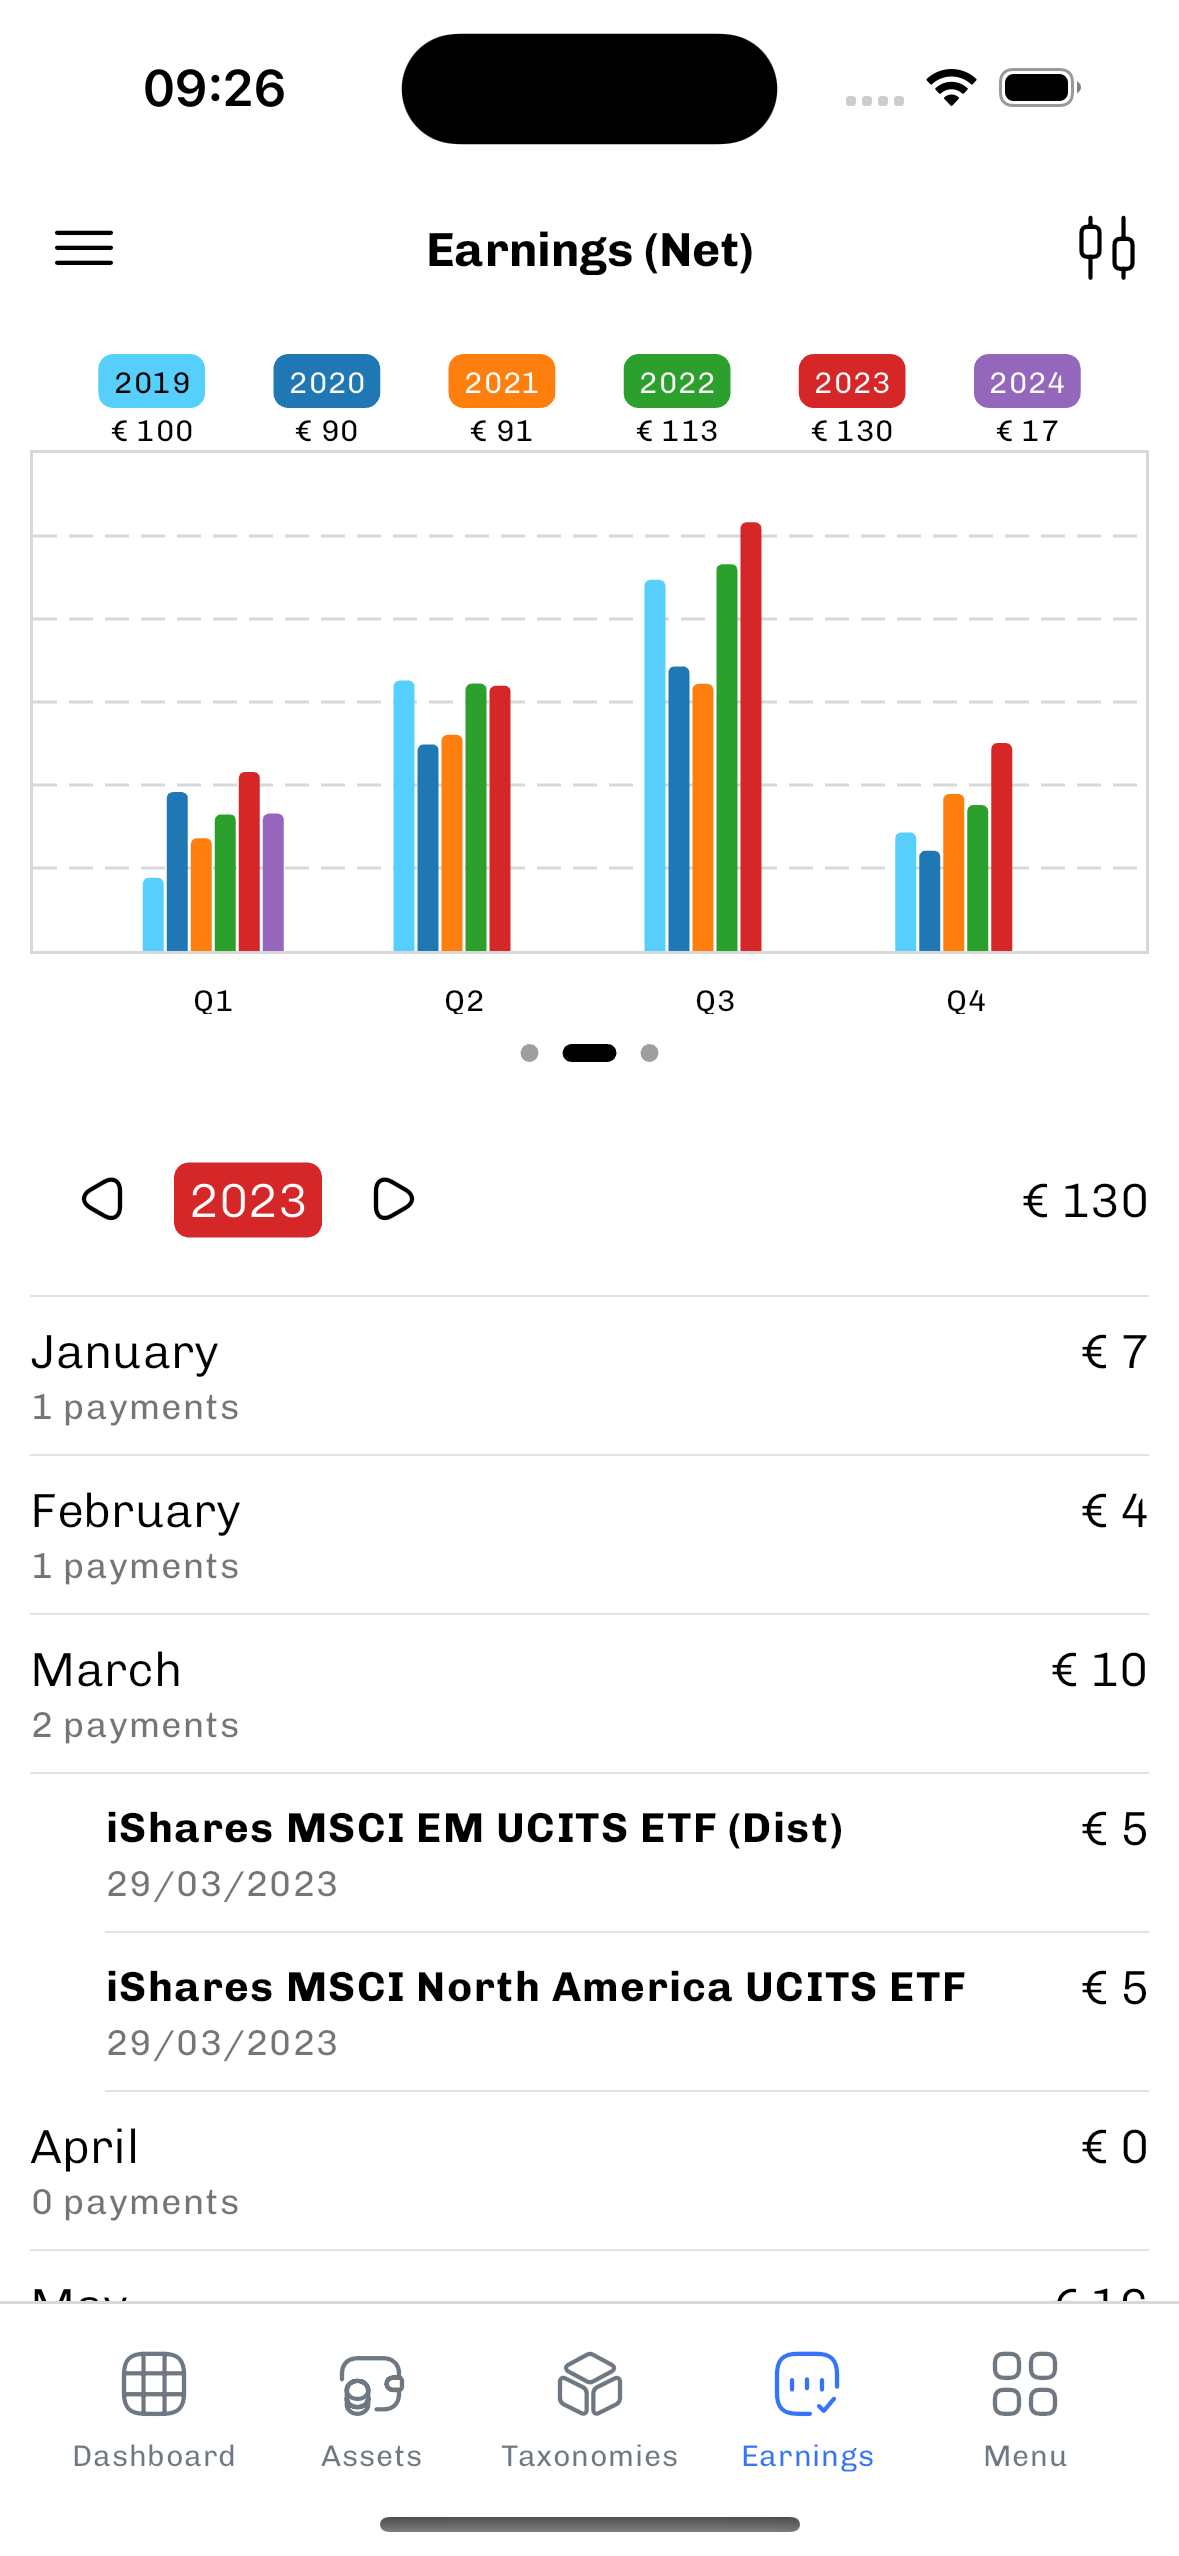
The Earnings View in the app displays your earnings, covering both dividends and/or interest payments, and allows you to view these as either net or gross values.
- Charts: Earnings are grouped and displayed by year, quarter, or month in the charts.
- Dashboard: Additionally, all elements from the Earnings View can be integrated into your dashboard. This allows for a customized view of your earnings, enabling you to tailor the dashboard to better suit your individual financial monitoring needs.
Performance #
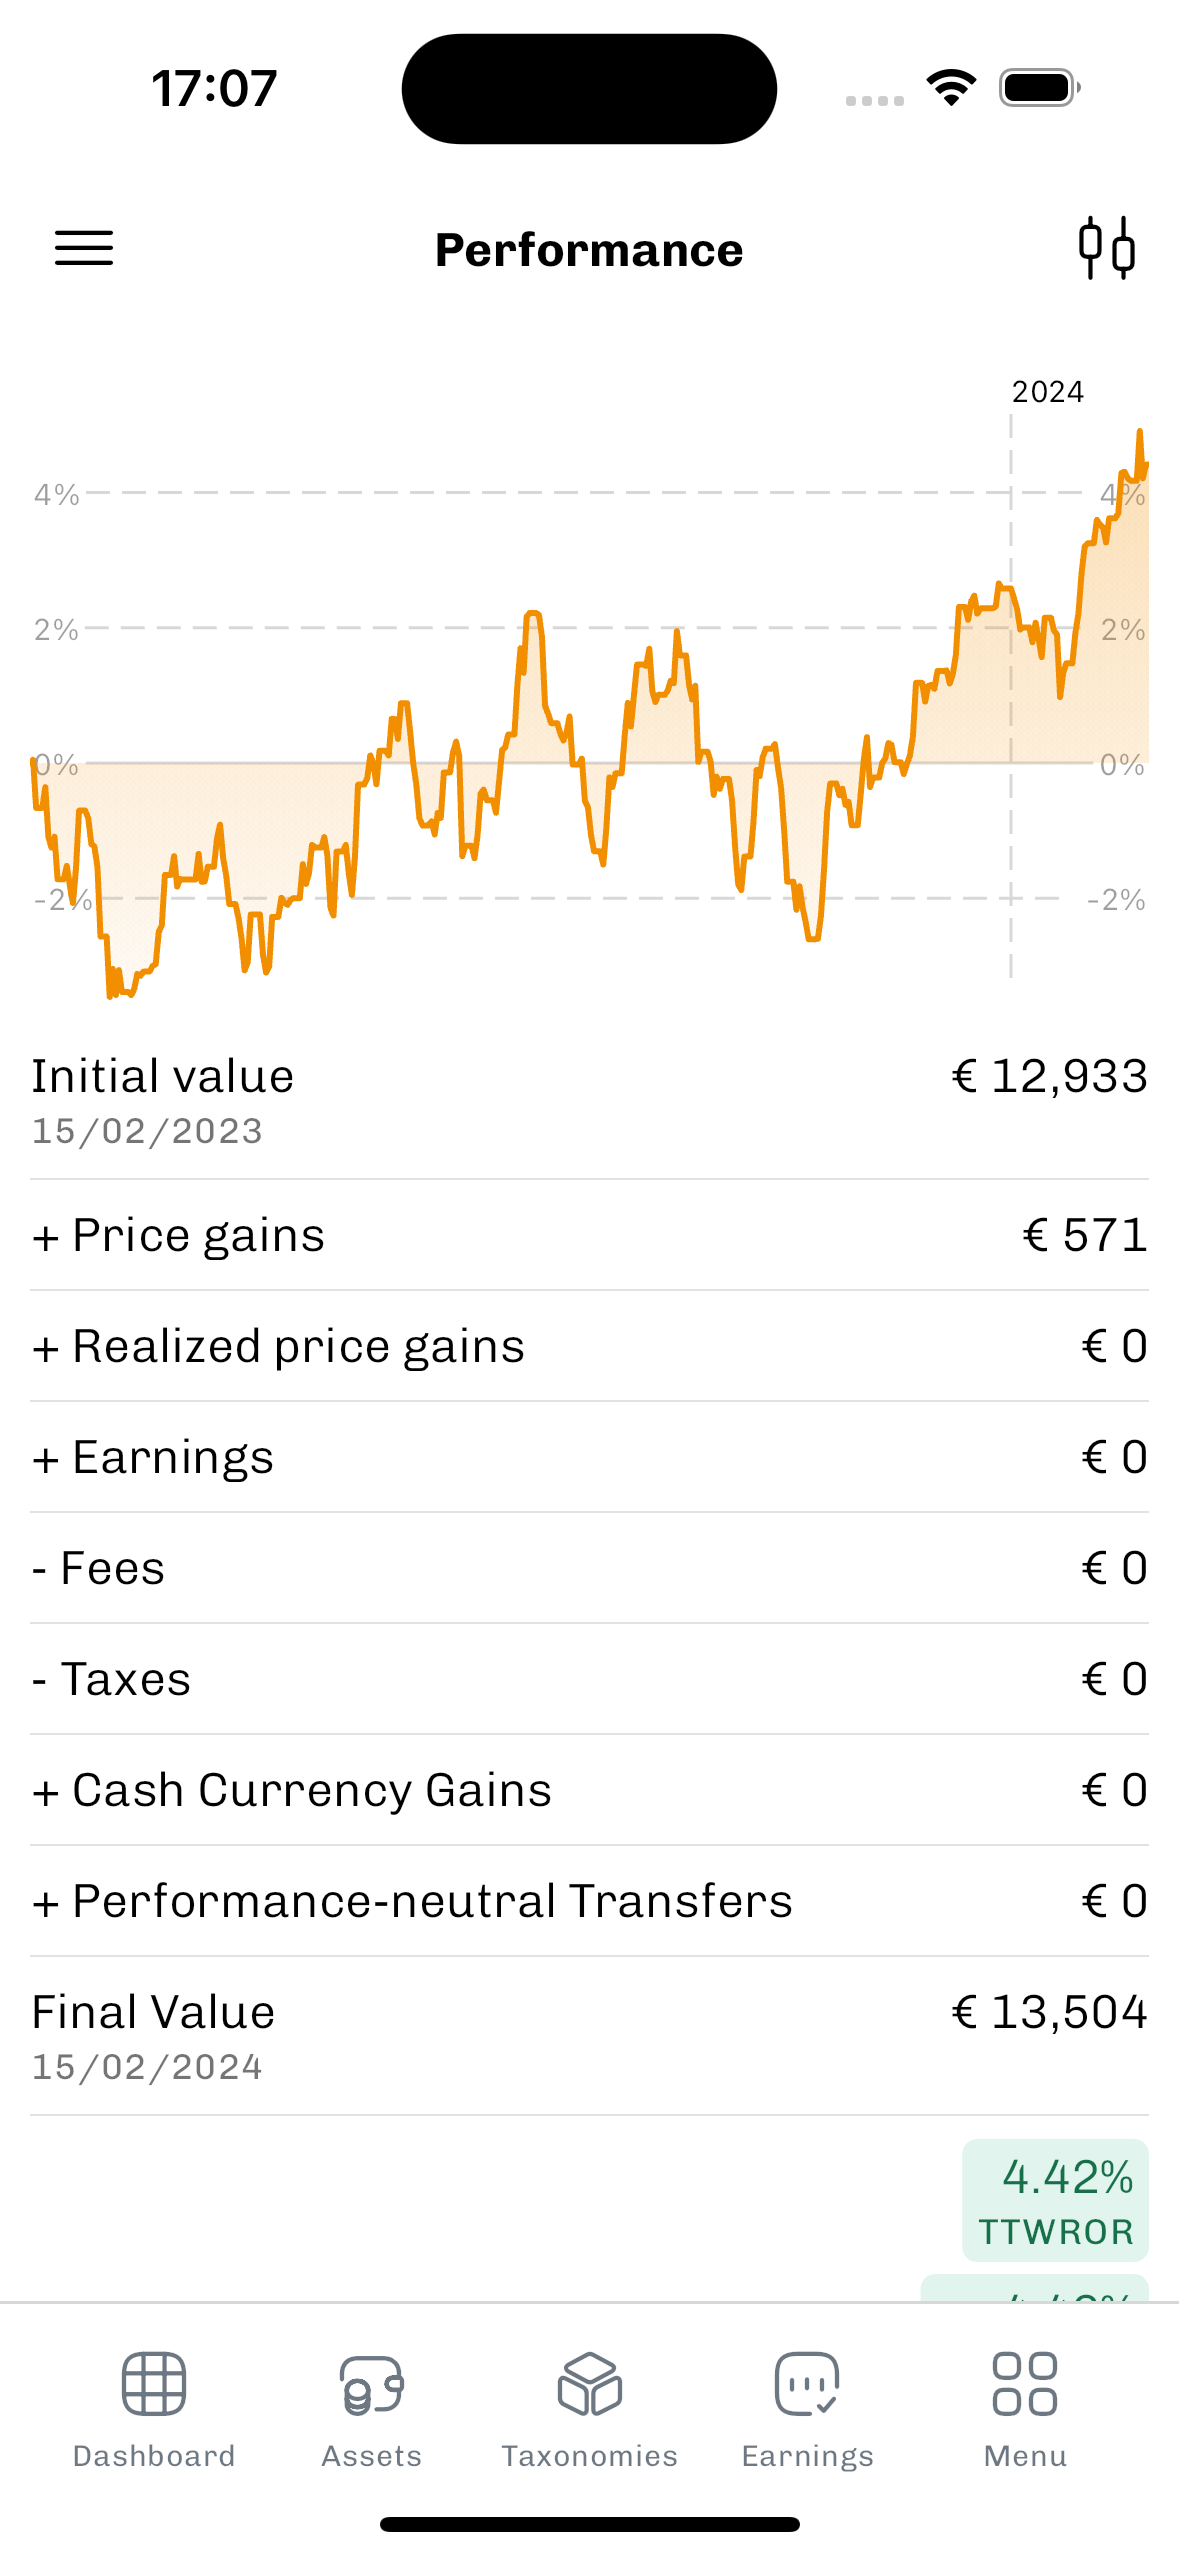
The Performance View is specifically designed to showcase the overall performance of your portfolio, measured as the true-time weighted rate of return.
The lower section of the Performance View details the various categories contributing to your portfolio's performance. These include:
- Realized and unrealized gains,
- Earnings,
- Cash currency gains,
- Performance-neutral transfers.